

The standard query at KillerSports comes with a preset list of display columns for game and player queries. But we also allow you to use SDQL to customize queries to display any results you wish given a certain set of conditions using the parameters @ conditions.
To do this you can list every parameter you wish to display, each separated by commas. You then include the @ symbol, followed by the conditions of what you want displayed (think of the conditions section as what you would include in a standard query)
As an example, to query the date, points, passes, and completions in Colts home games in 2023:
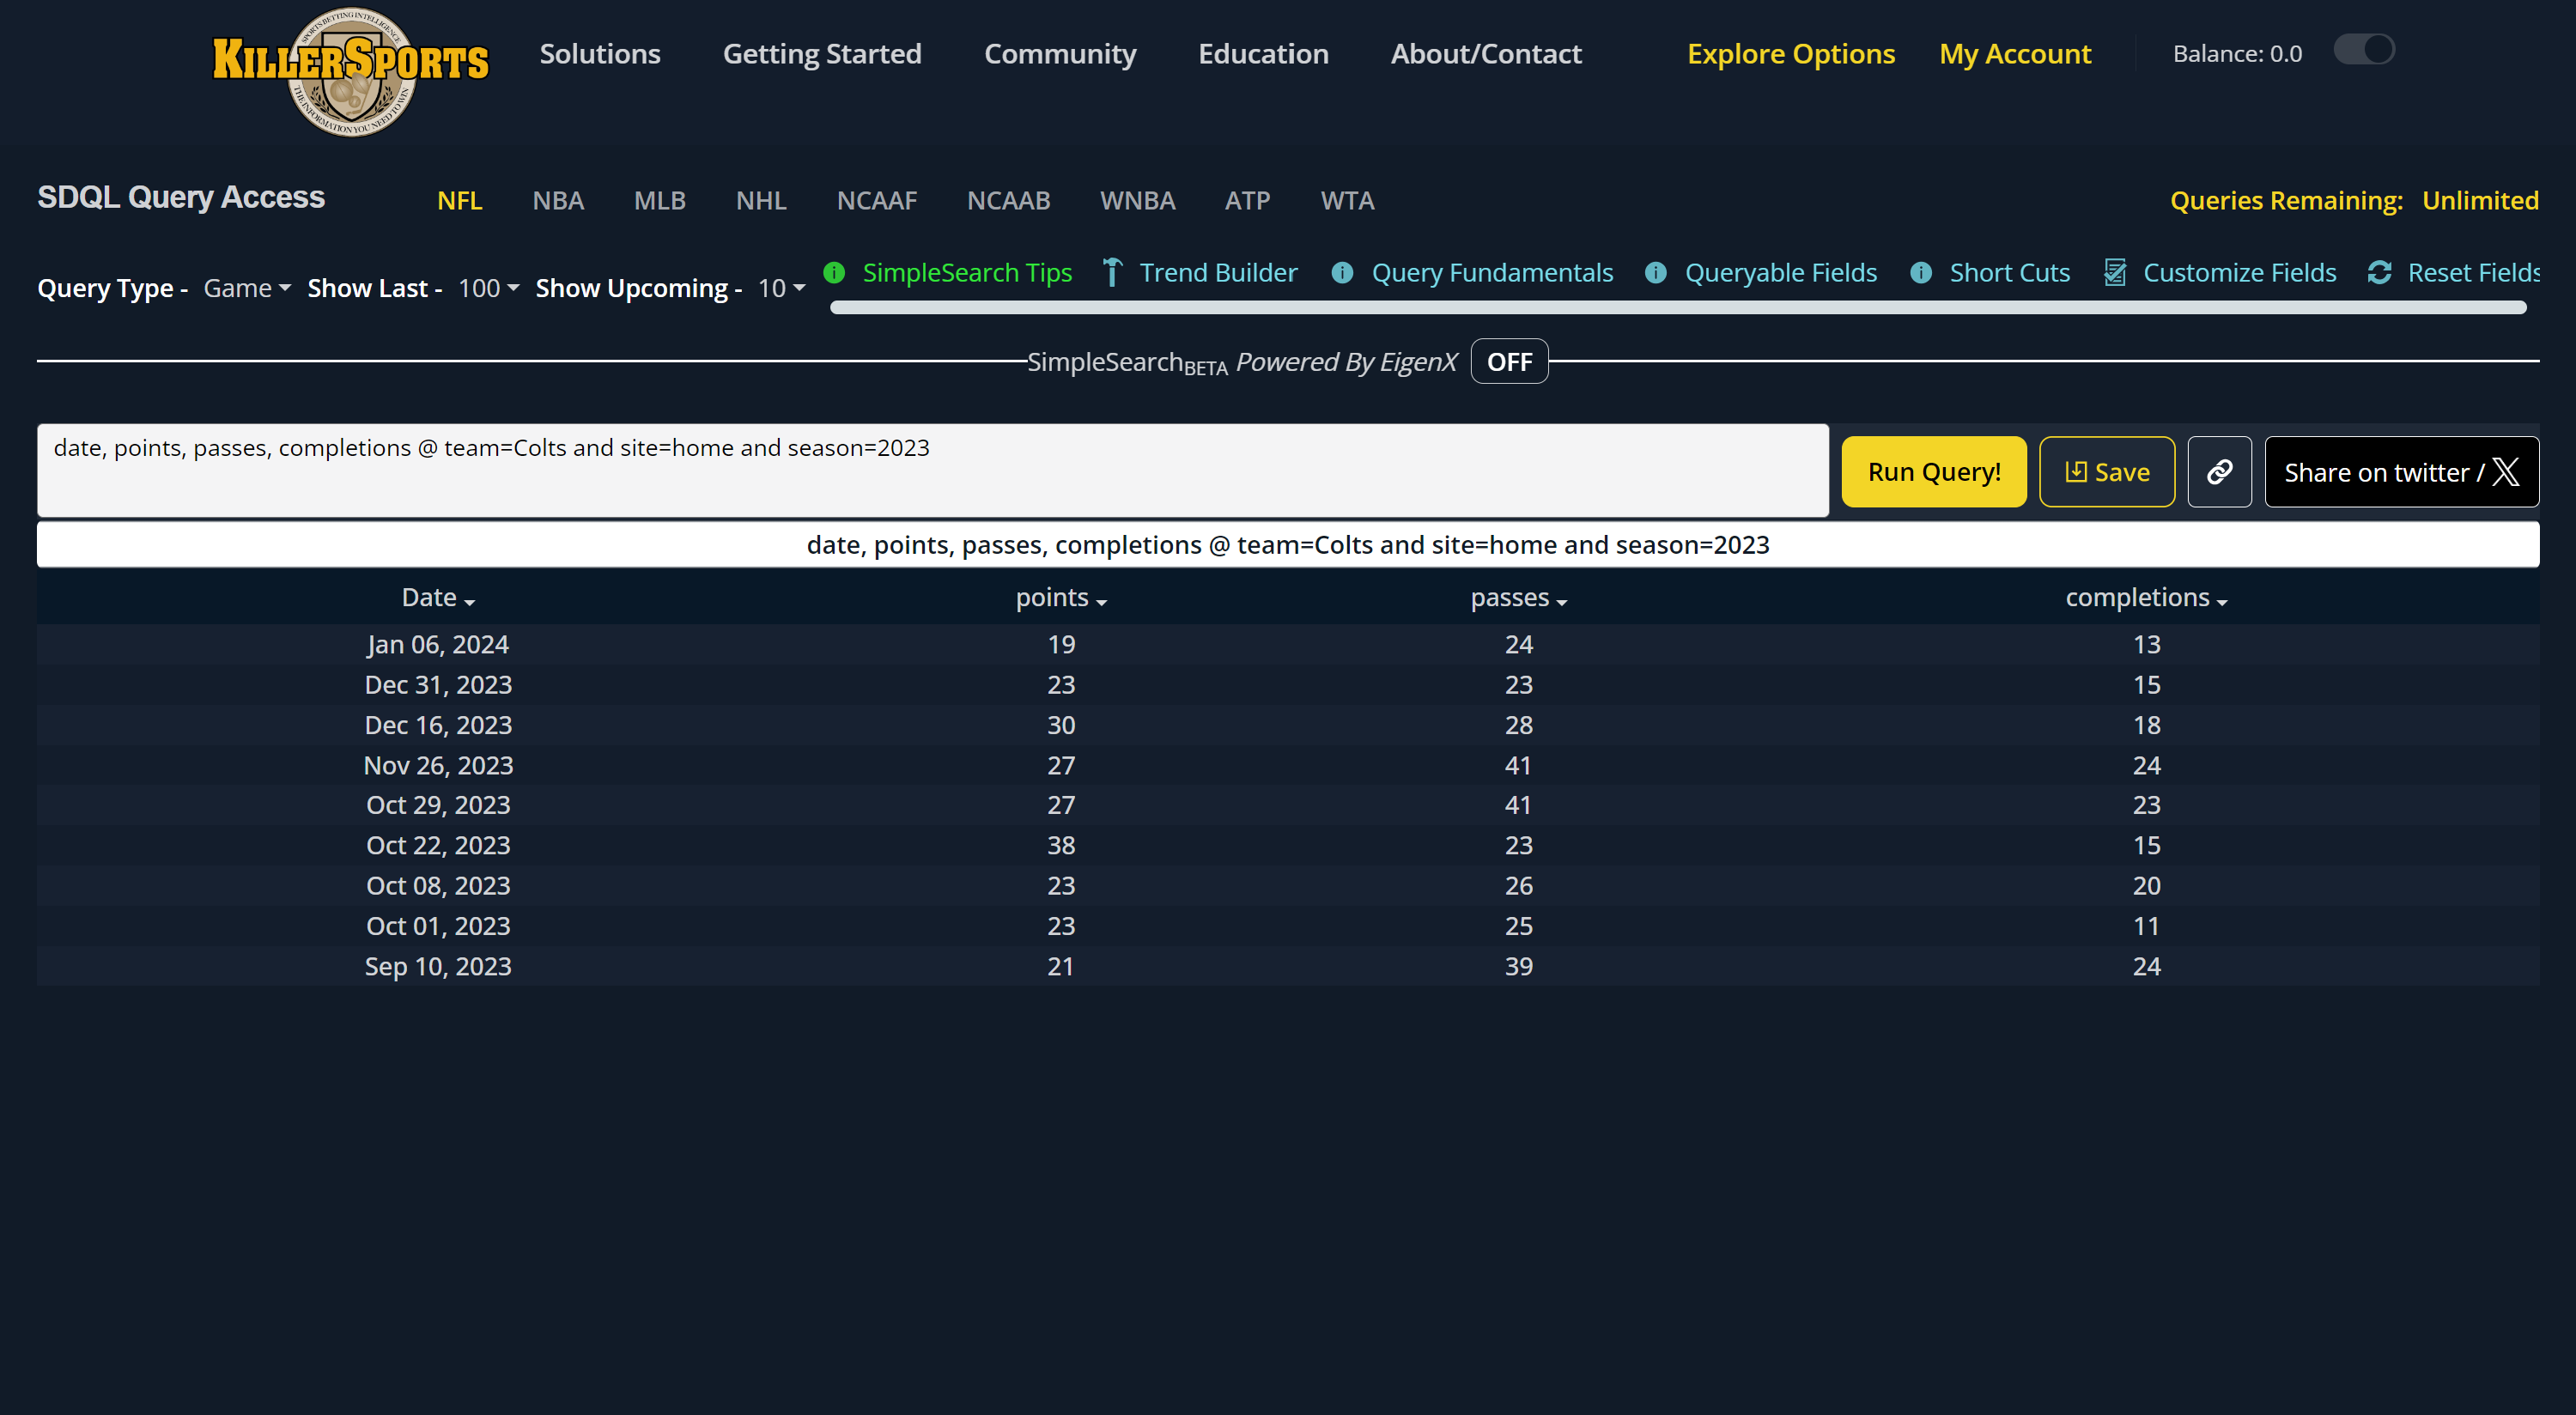 date, points, passes, completions @ team=Colts and site=home and season=2023
To create a sortable data table with NFL team scoring data, use:
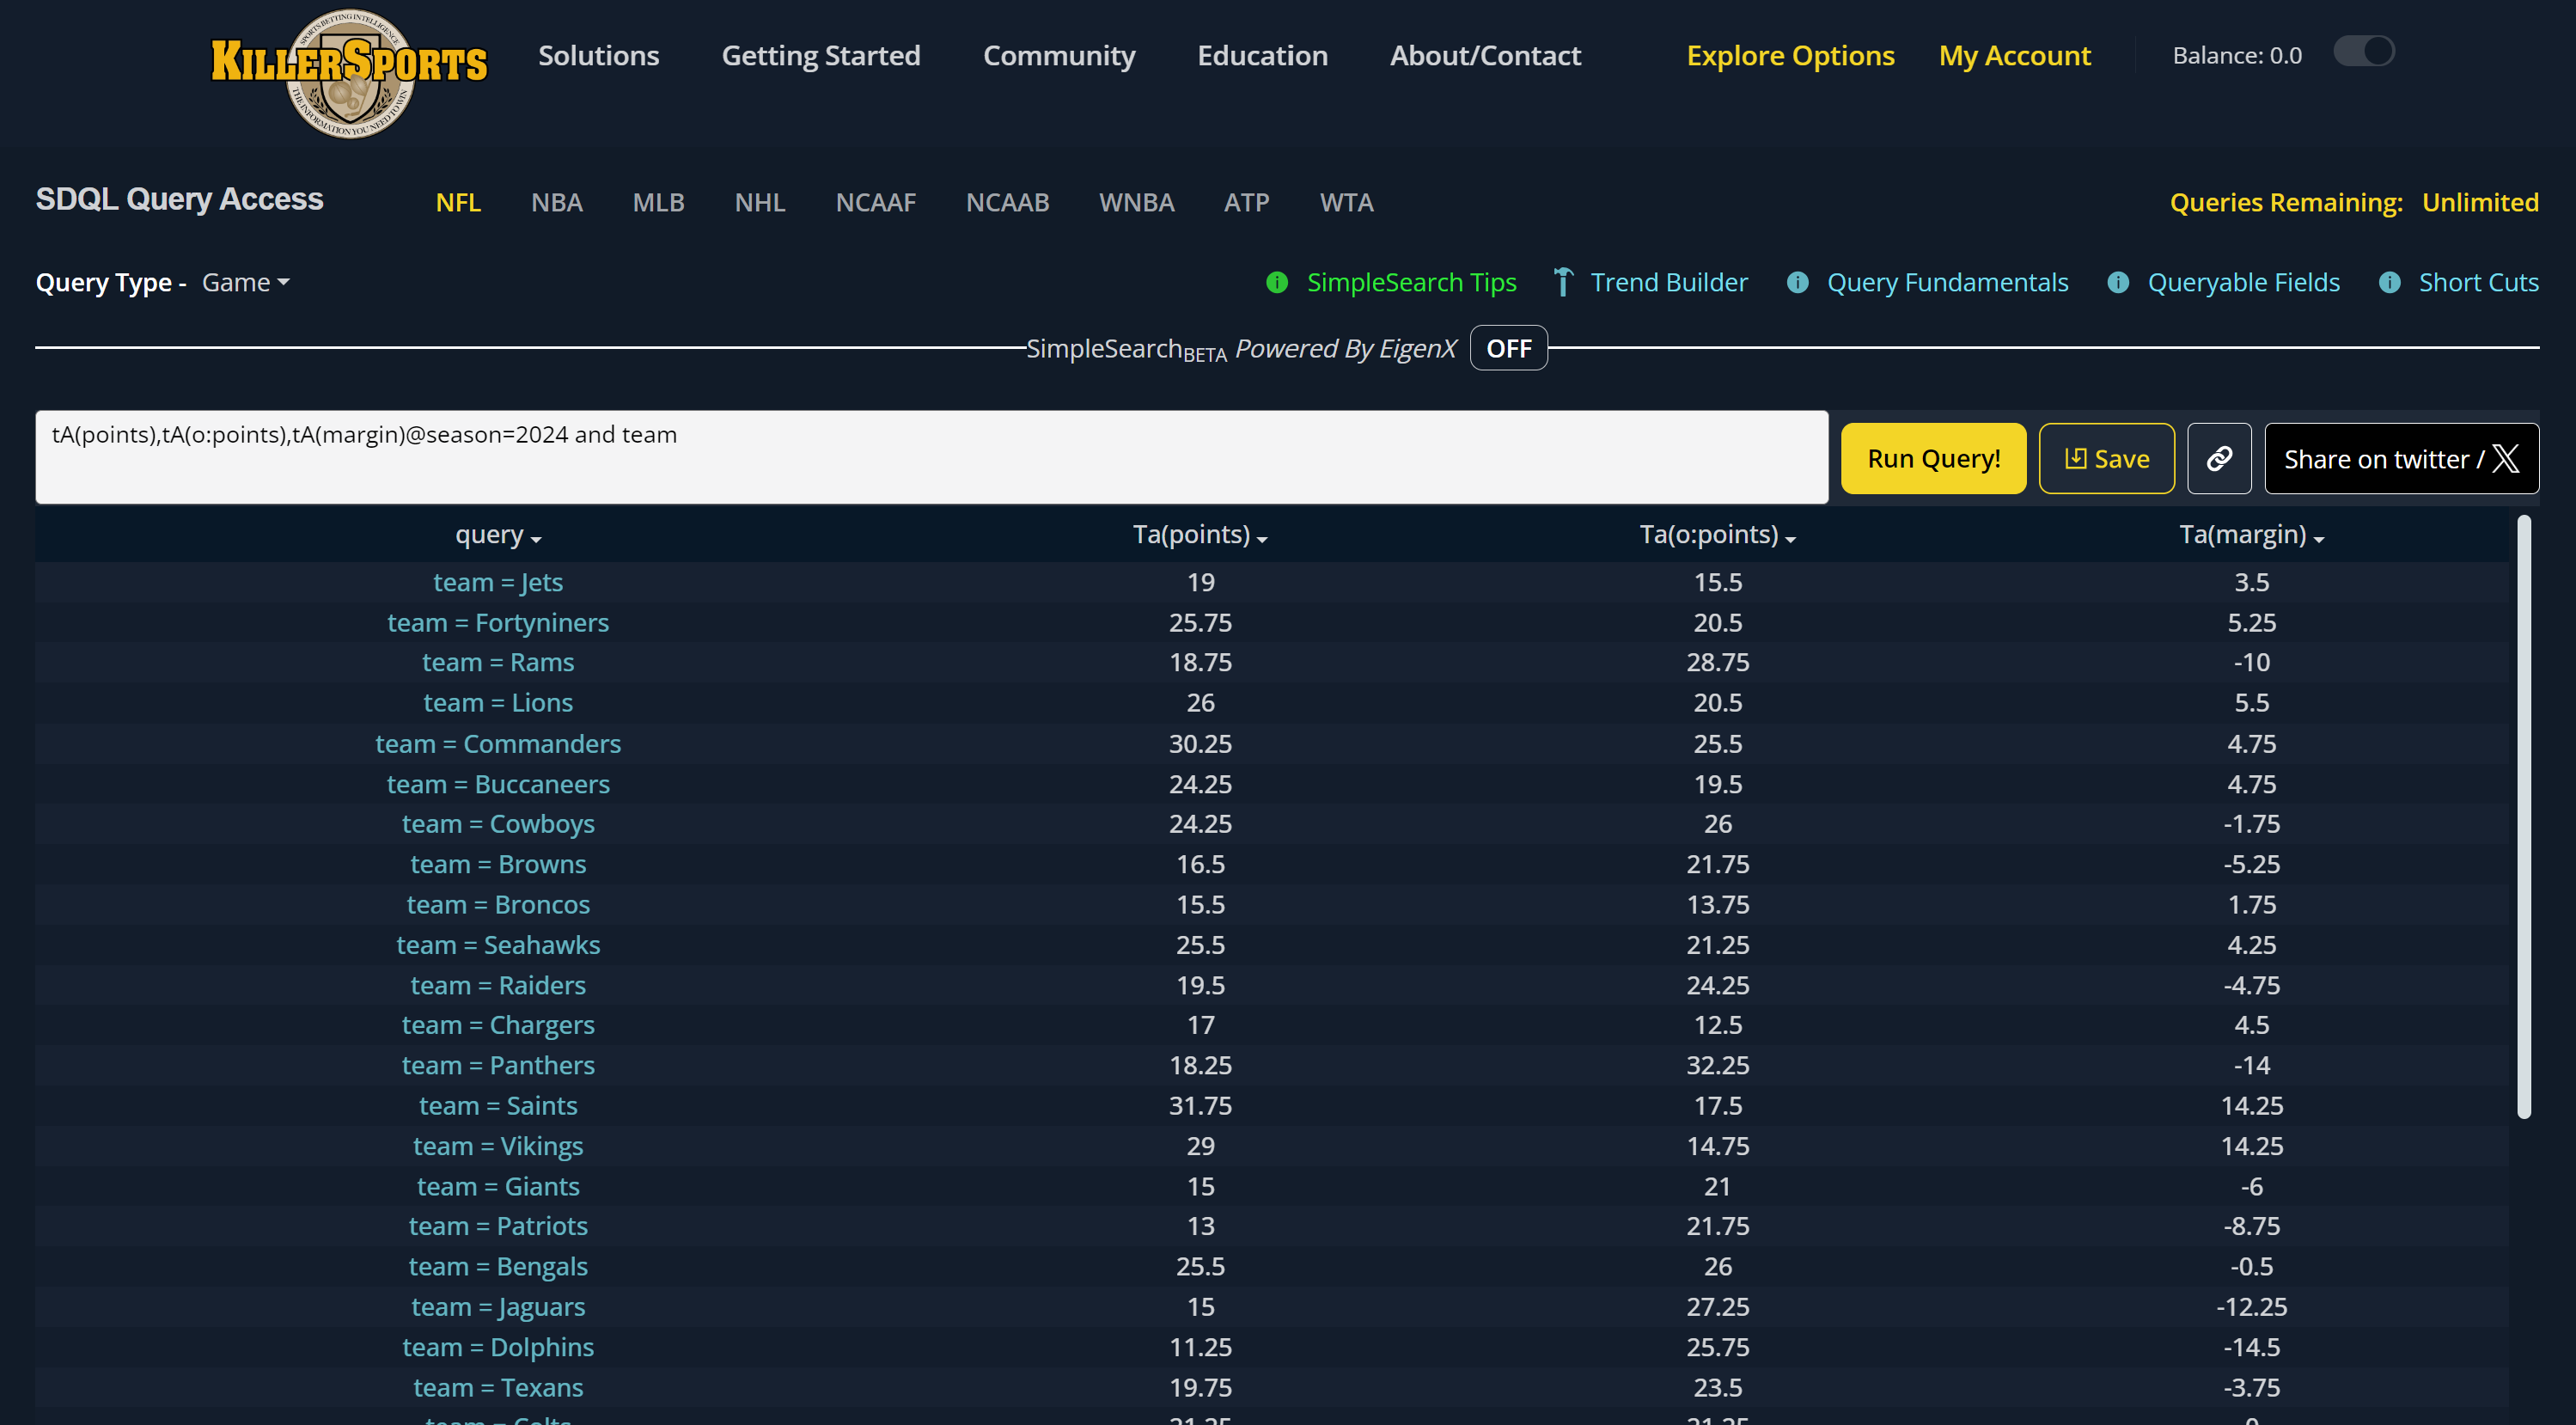 tA(points),tA(o:points),tA(margin)@season=2024 and team
To see as list of all the occasions where an NBA player scored 55+ points in a game, you could run this custom table with the player query type:
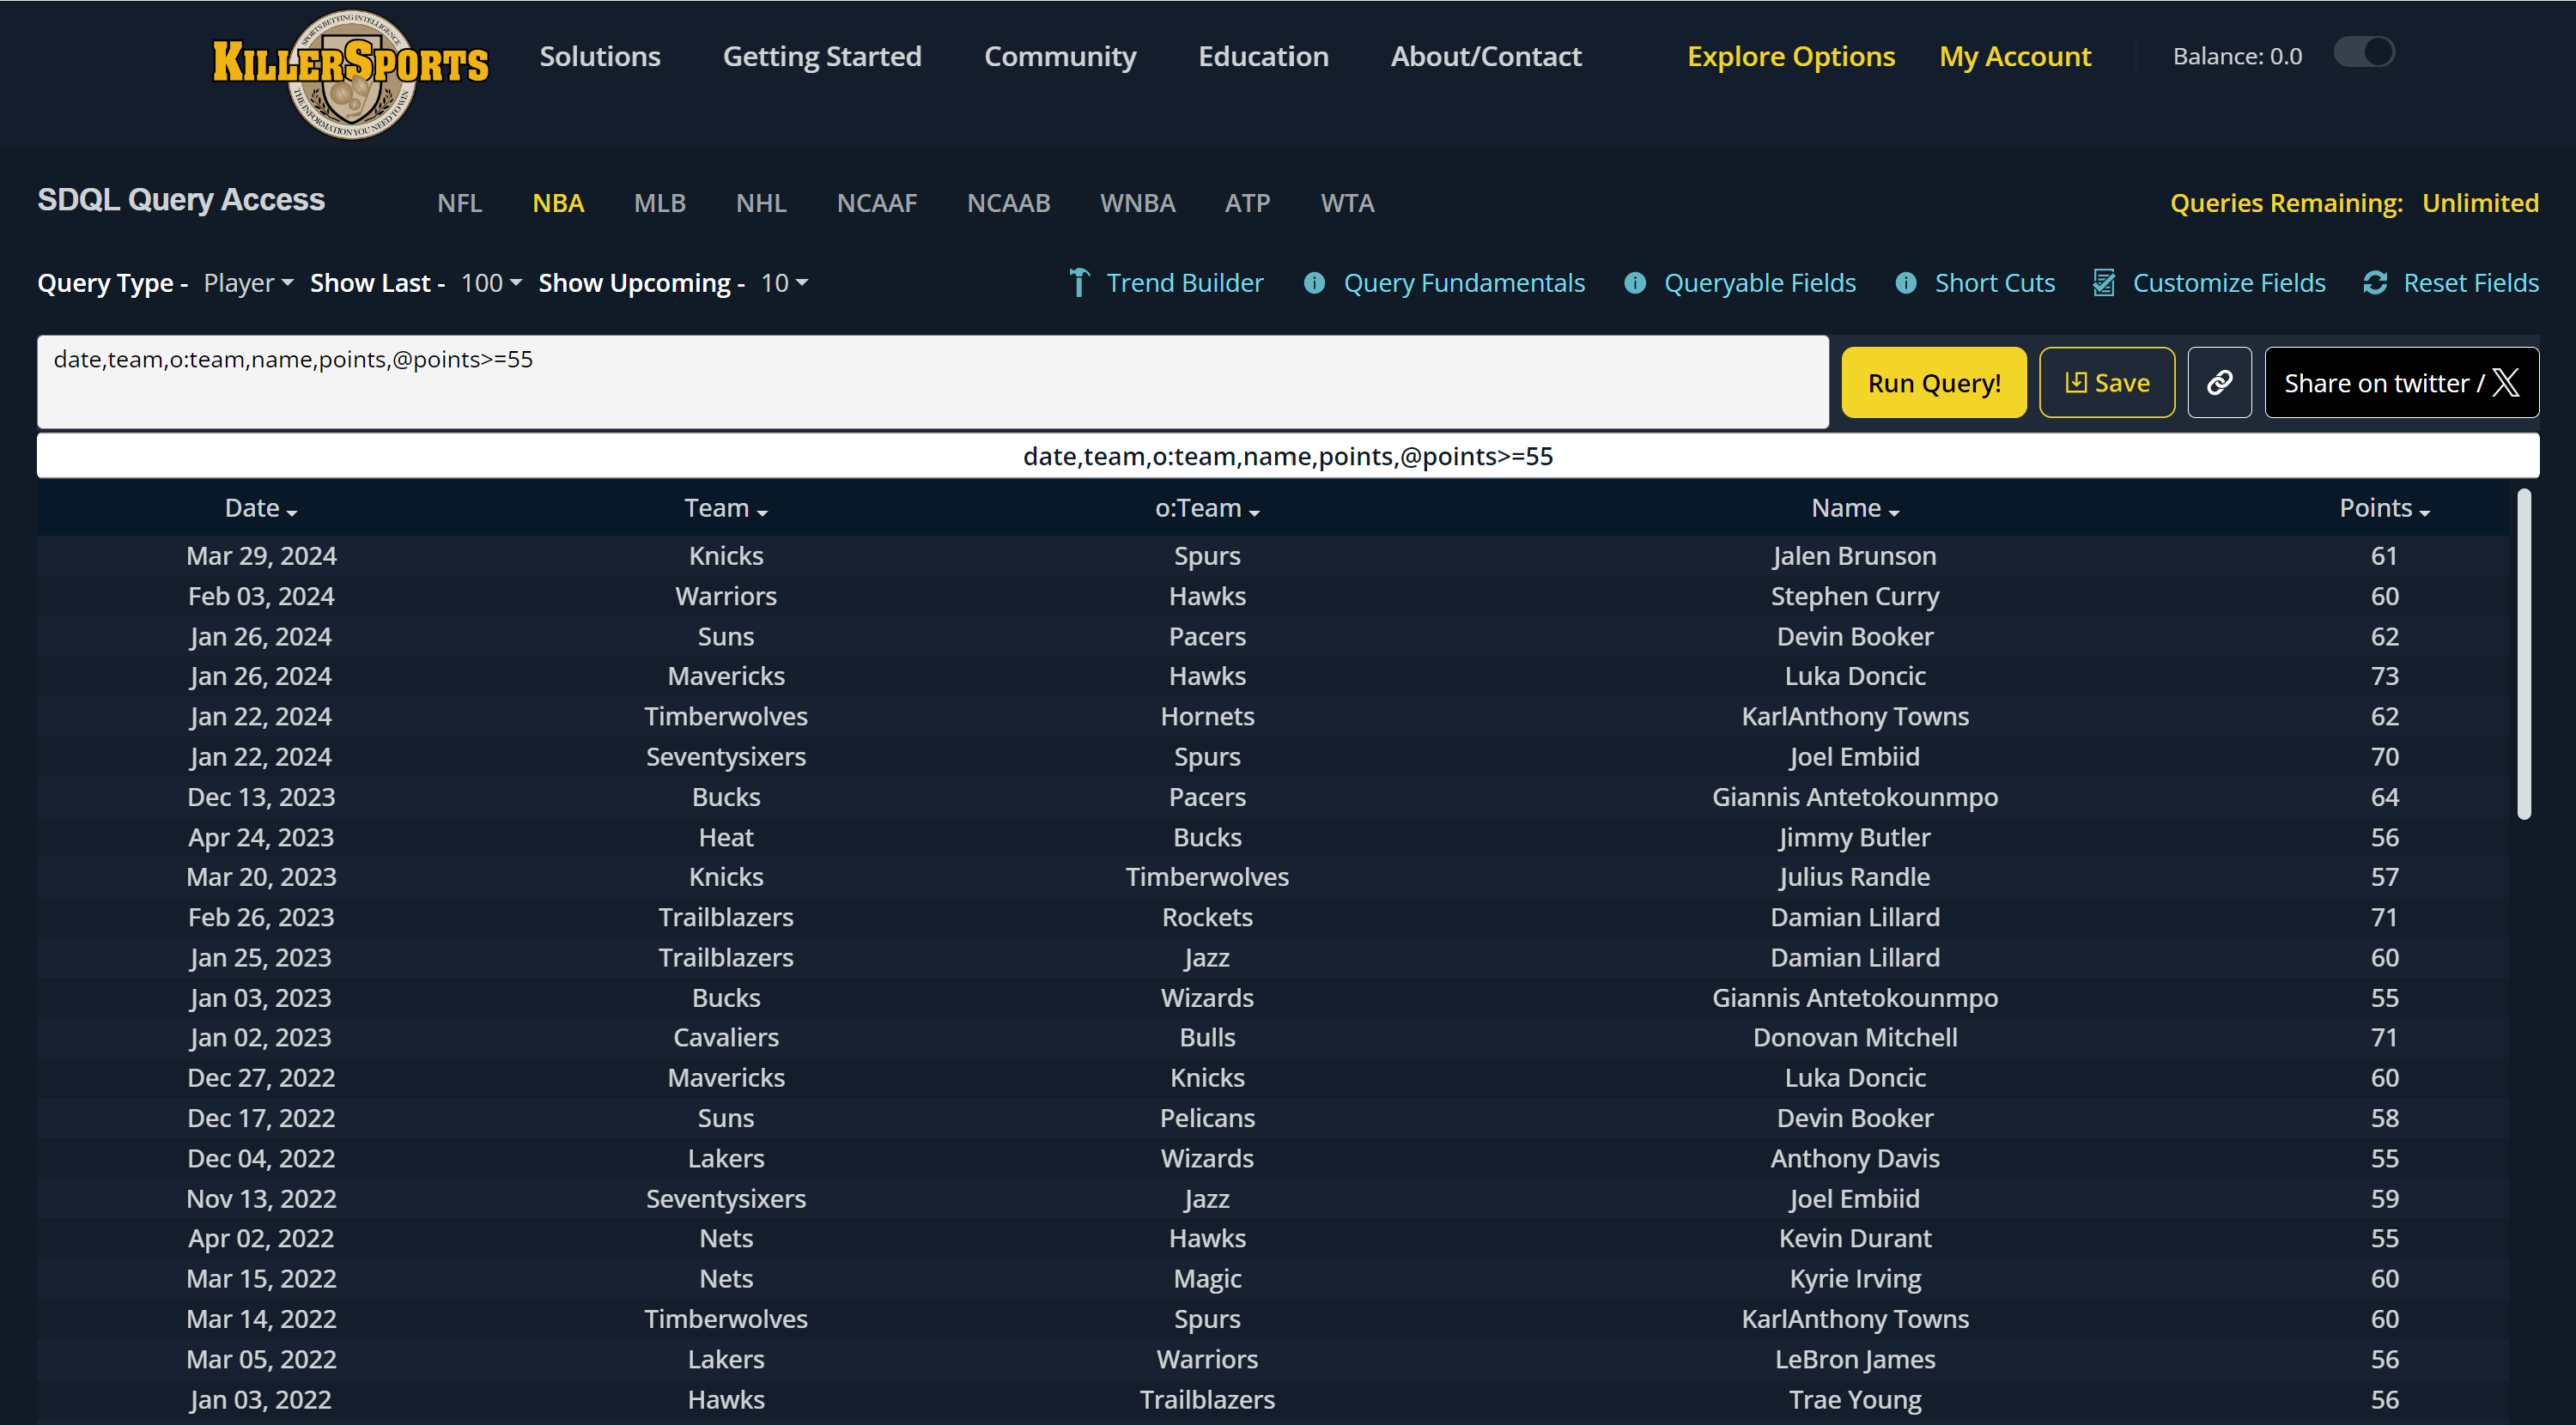 date,team,o:team,name,points,@points>=55
Obviously with the capability to include whatever parameters and conditions you want, the possible applications for custom tables are endless. But let's look at a few possibilities.
Custom tables can be a great tool for looking at data related to team total and player prop data.
Let's say we want to know how frequently an NBA team scores at least 115 points (their team total is 114.5 in this example) the game after scoring at least 130 points. The parameters I want in this case are
Sum(points>=115) and Sum(points<115). We can also name those column if we choose. In this case we will make those Over and Under. The condition we want is p:points>=130. Using this custom table
query we can see how many times a team has gone Over or Under this point total:
Sum(points>=115) as Over,Sum(points<115) as Under@p:points>=130
Just as with a standard query, we can leave a parameter open and see the result for all possible values. So instead of looking at 2017 forward, let's see the result for every season:
Sum(points>=115) as Over,Sum(points<115) as Under@p:points>=130 and H and line<=-7 and season
The same concept applies to looking at Yes/No Run First Inning Data. To look at the Yes/No First Inning Run Data in Guardians games since 2023 as a +150 or greater underdog, we would use:
Sum(S1+o:S1>0) as Yes,Sum(S1+o:S1=0) as No@team=Guardians and line>=150 and season>=2023
We can use the same concept to look at player prop lines. We would use this custom table query to see how often Gerrit Cole has struck out more or less than 7.5 batters (a theoretical K prop number) following a start where he struck out at least 10 batters.
Sum(SSO>7.5) as Over,Sum(SSO<7.5) as Under@s:SSO>=10 and starter=Gerrit Cole